A quick look at QQQ performance since its inception in 1999 shows why this ETF has been so popular with investors. If you were smart enough to buy and hold one share of the stock since then, you would have experienced over 900% in total returns through November 2024.

Of course, the percentage return of any stock is only relative to how the broader market performed, so most analysts compare returns to the S&P 500. While the QQQ is much “younger” than the SPY, it has been around long enough to have experienced several market crashes, including the Dot-com bubble, the Great Financial Crisis, and Coronavirus stock market crash. This makes the QQQ an intriguing investment as its long-term returns have weathered several key moments in recent history
With over 30 years of comparable data available, I decided to highlight a handful of notable time periods below to compare QQQ performance vs the SPY. Given that most investors consider QQQ to be a technology ETF, this comparison offers some insight into how technology stocks have performed in both bull and bear markets compared to the S&P 500.
QQQ Performance Year to Date
As of November 2024, the Invesco QQQ is up 24% year ti date. The stock opened at $409.52 on the first day of trading in January, and was priced at $504.98 when I wrote this piece. In comparison, the SPY is up 26% year to date in November. While almost every sector was down last year, oil and energy stocks have outperformed across the board. This likely explains the differential between the QQQ and SPY, as the latter has 5% of their holdings in energy stocks.
Since technology stocks have become the largest companies in the United States, the divergence between the SPY and QQQ holdings has narrowed. In fact, the Top 5 holdings of each fund are nearly identical, with AAPL, MSFT, GOOG, and TSLA leading both funds.
Coronavirus Crash, Rebound, and Post-COVID Downturn
The impact of COVID lockdowns and federal stimulus funds turned the stock market into a roller coaster ride between 2020 and 2022. The Nasdaq experienced its largest single day drop of over 12% on March 16, 2020 and yet still finished with a 45% total return for the fiscal year. The stock market continued to peak through 2021 before heading into a downturn as interest rates began to rise in 2022.
The chart below compares QQQ performance vs SPY from March 2022 through November 2024.

This chart covers a couple weeks before the bottom of the Coronavirus crash through the 2022 QQQ lows in mid-October. Again, I find it interesting that QQQ outperformed the SPY slightly here at 139% vs 105%.
Great Financial Crisis
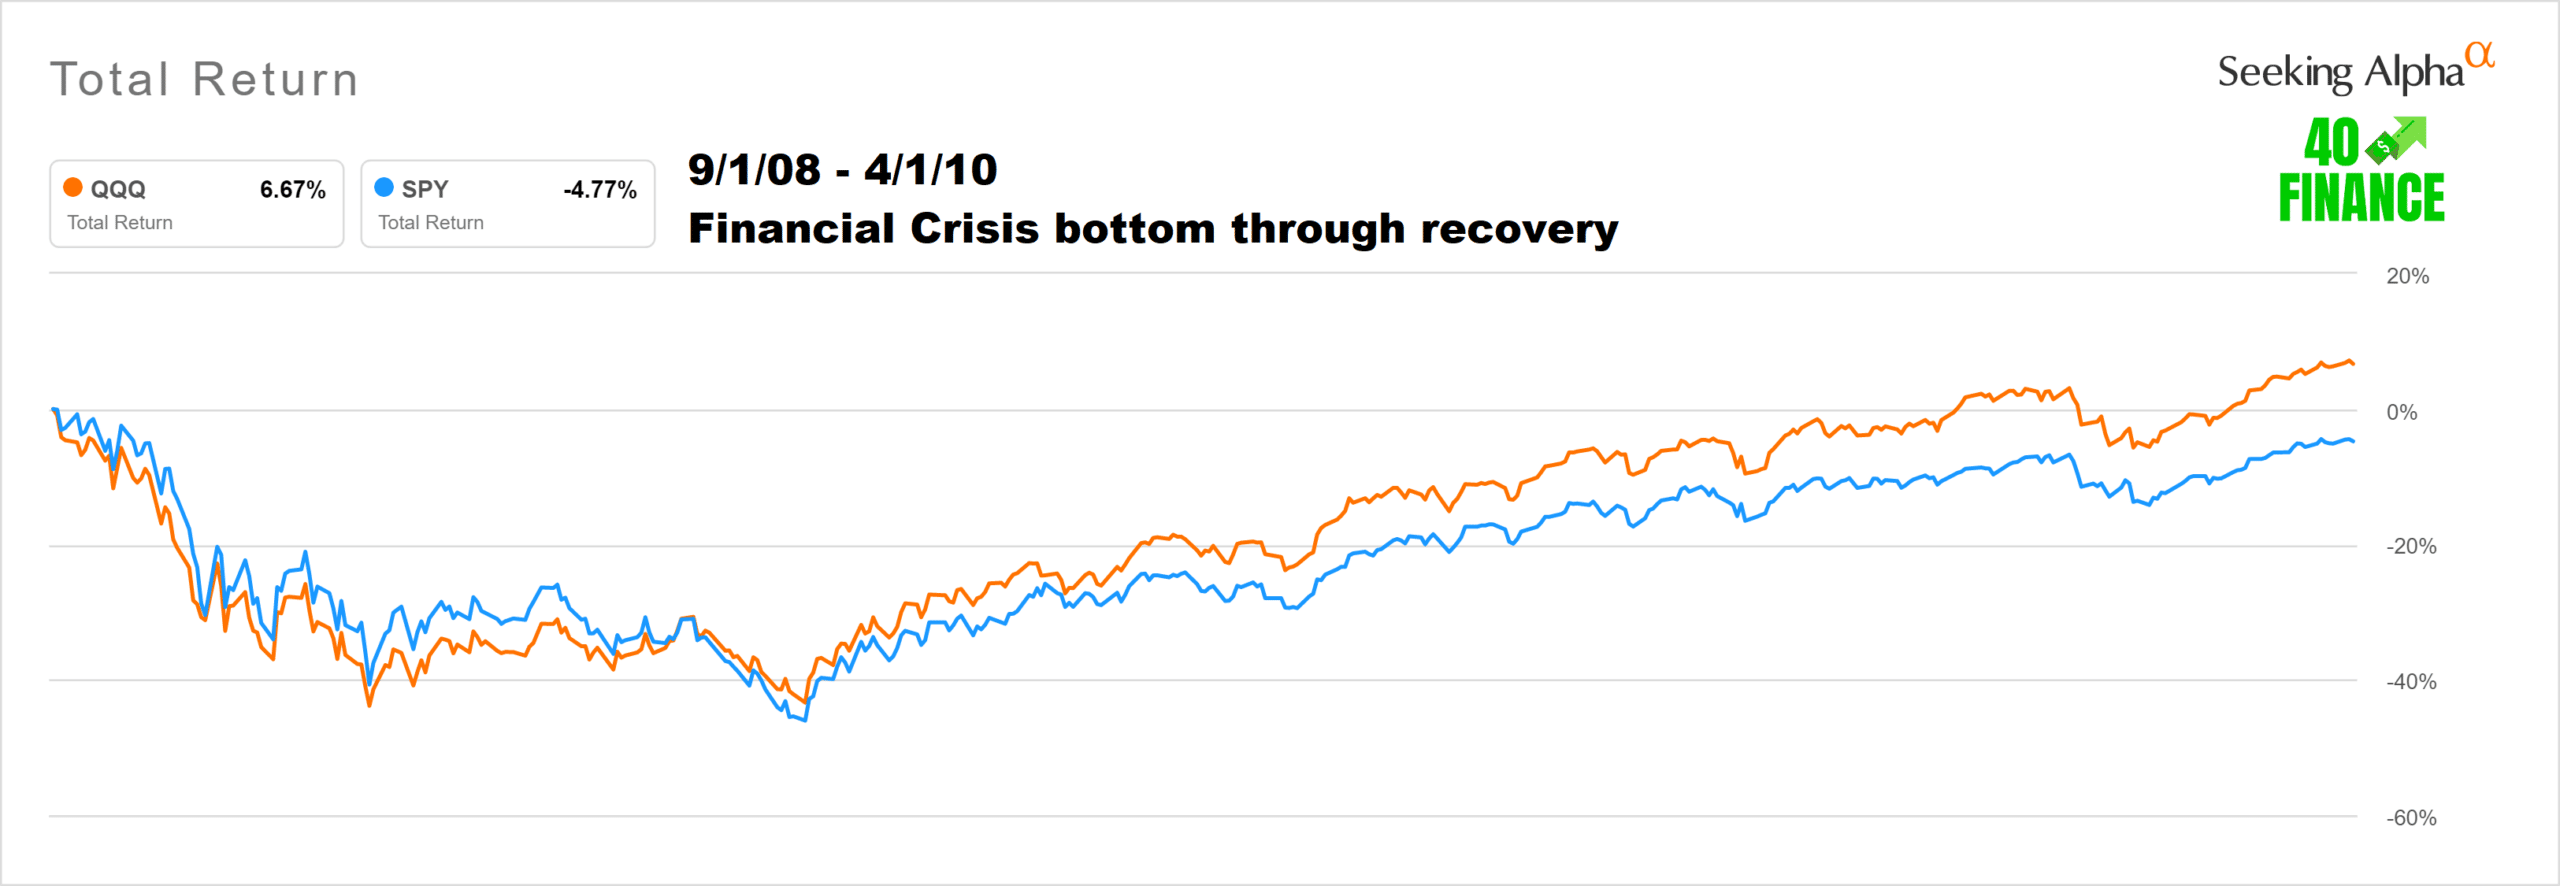
The Great Financial Crisis pushed the stock market downward for almost a full year and it took over a year for both the SPY and QQQ to rebound back to pre-GFC highs. The QQQ reached a bottom in November 2008 at $25 and it wasn't until April 2010 that it returned to its 2008 high of $49.
While the QQQ did experience a larger percentage drawdown on the downtrend, it also recovered faster. The 2008 high for the SPY came in April at $143. It didn't close above that price until September 2012!
Dot-Com Crash
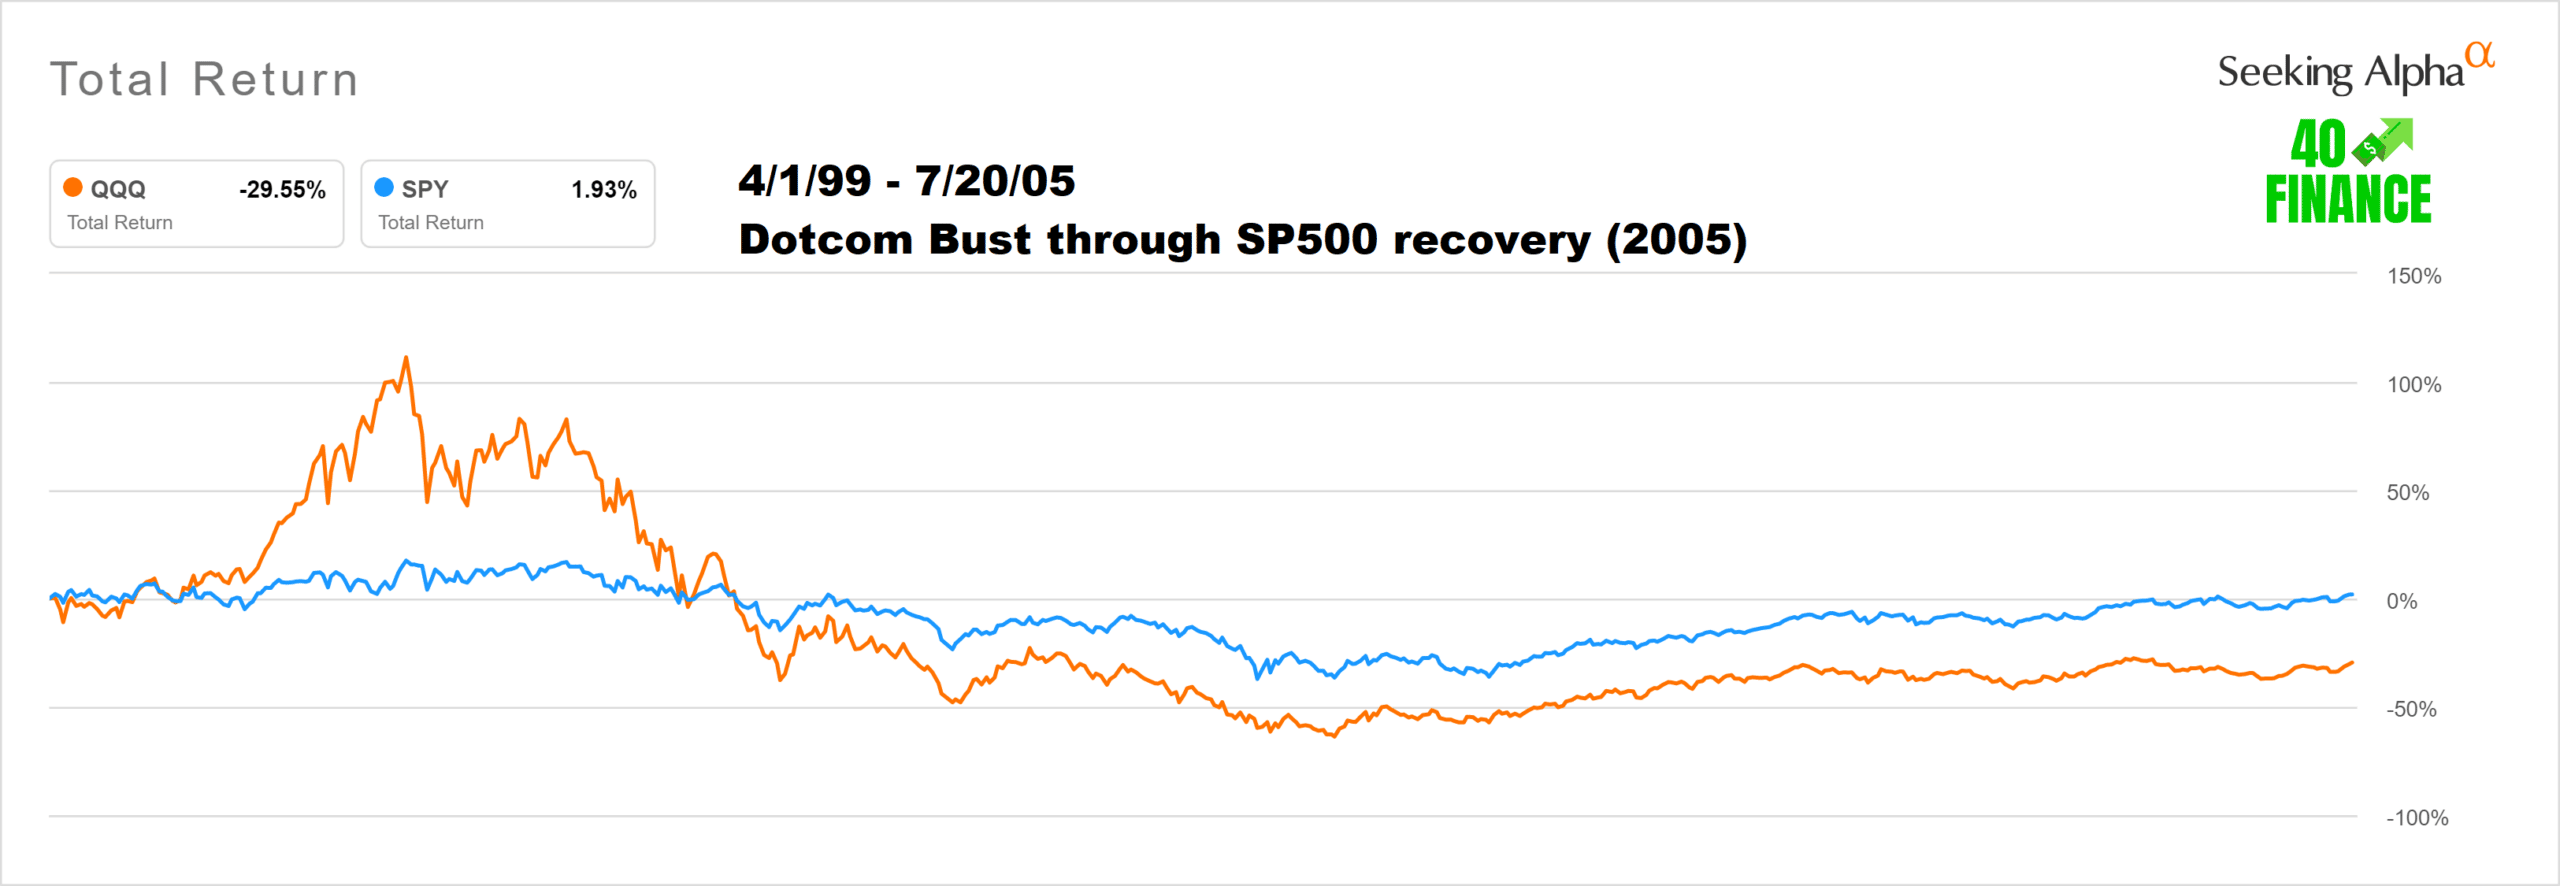
The most convincing argument you'll hear against the QQQ often involves data from the dot-com crash. Frankly, it is a wonder the QQQ even survived this period given that its inception date was March 10, 1999.
On March 24, 2000, the QQQ closed at a pre-crash high of $117. The bottom came on October 7, 2002 when it fell to $20 a share, which was over 80% off the highs. Even the 5-year chart below from 1999 to 2005 can't capture the return to highs. The next time QQQ closed above $117 was August 4, 2016… 16 years and two market crashes later!

The SPY peaked at $150 in August of 2000. Its low came in at $78 at the close on October 2, 2002. So while the QQQ lost over 80% peak to trough, the SPY retained just over 50% of its highs at the bottom.
The significant difference between QQQ vs SPY after the dot-com crash was recovery time. Instead of the 16 years it took the QQQ to get back all of its losses, the SPY was able to reach $150 in May of 2007, recovering in less than half the time.
QQQ Total Returns
The following chart from the Invesco website shows the most recent 1-year, 3-year, 5-year, and 10-year returns for the QQQ. Note this information is updated monthly on the fund's website.
2022 dealt a significant blow to QQQ's total performance, but the long-term returns are still positive. Given that most investors would agree we are near a current market bottom, one would assume the total returns will improve from here, almost certainly over the next 3-5 years.
QQQ vs SPY Performance
Since its inception in 1999, QQQ performance has outshined the SPY by a significant margin. The catch is that most investors didn't buy the stock on the inception date. In fact, if bought any time between March 2000 and August 2016, you likely had a cost basis hole to dig out of.
The most important question is, how will the QQQ fare against the SPY in the future? When you consider how closely tied the top holdings are between the two funds, I consider it very unlikely that QQQ will ever diverge form the SPY like it did during the dot-com crash. For me, this expectation was exemplified during both the Great Financial Crisis and the Coronavirus Crash, where the QQQ and SPY stayed within a reasonable range when you zoom out over a period of years.
As a QQQ investor, I remain bullish on the long-term outlook of the stock. It is important to look back at history for clues, but no crash or recession is ever the same. If you project the market from a bullish view, it is hard to imagine that the tech stocks that lead the QQQ today won't be at the core of our next bull market.

